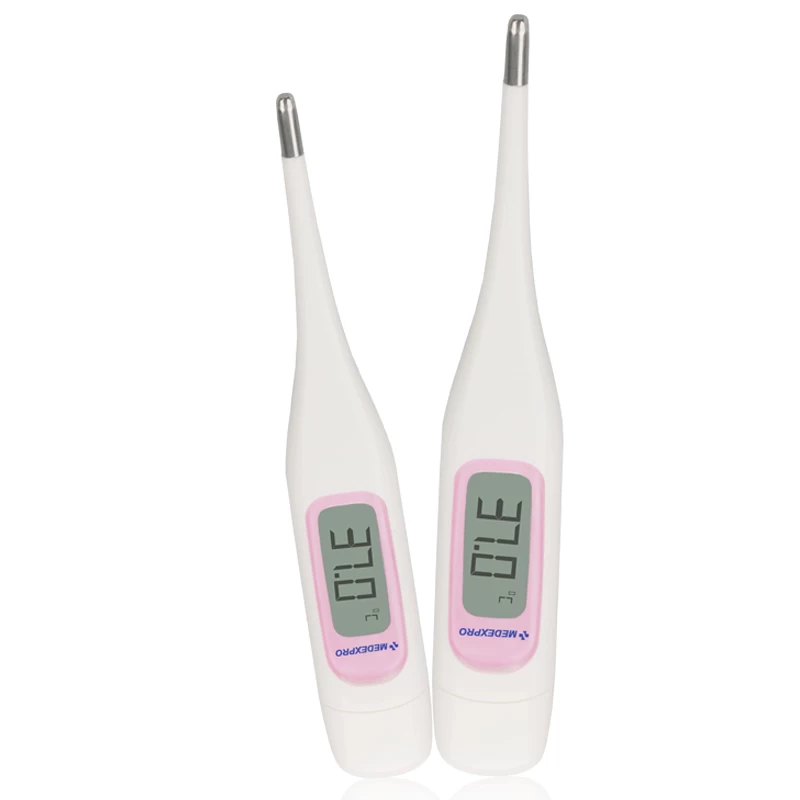
BASAL BODY TEMPERATURE CURVE
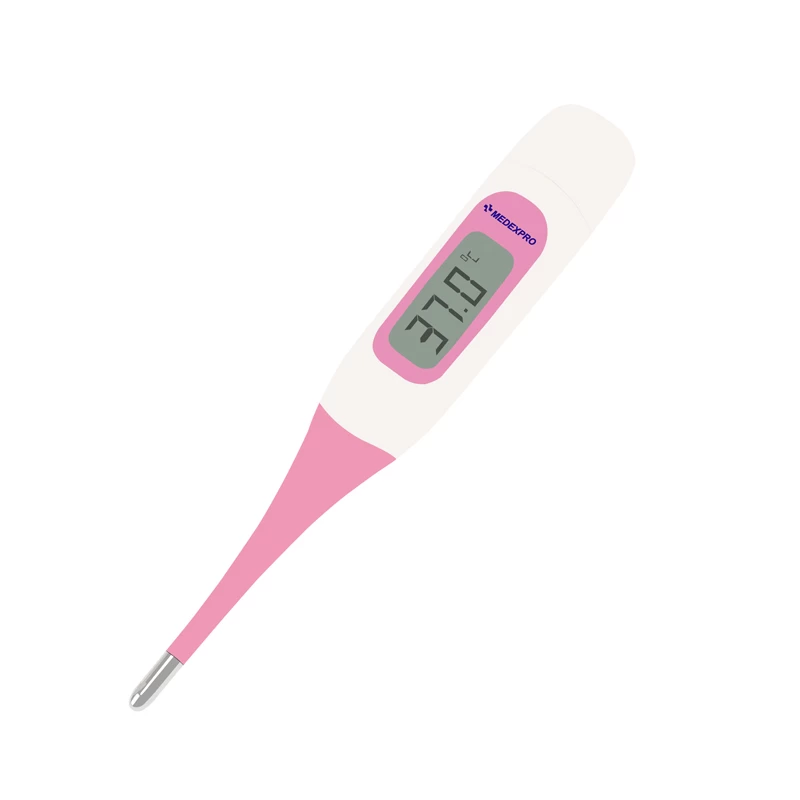
The Basal Body Temperature(BBT) consists of two phases with the day of ovulation in the middle.The BBT is lower prior to ovulation and higher after ovulation.1 or 2 days after ovulation the temperature shifts into the high range and stay and stays there for about 2 weeks,it then drops prior to menstruation.The changes in a person's BBT can be understood by recording the BBT over several months.
Copy the Basal Body Temperature Chart on the reverse side to record your BBT.
The BBT Curve
The BBT curve indicates a woman reproductive cycle,her sexual function and health.Recording the BBT over a period of several months allows one to estimate the day of ovulations as well as the date of the start for next menstrual period in order to determine when pregnancy is mostly likely to occur and to use birth control measures if necessary.In addition,the information may also assit in the discovery of gynecological disorders or psychosomatic conditions.
It is recommended that an obstetrician-gynecologist be consulted when there are concerns about the BBT curve or feelings of malaise occur.
Normal BBT Curve(drawing2)
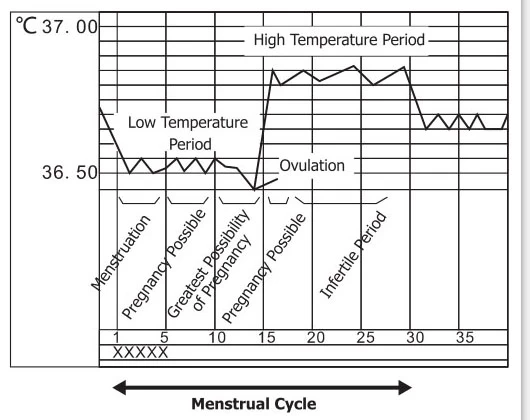
drawing2
There may be individual differences in the elevation of temperatures.
Email:sanieleung@dor-medex.com
Related News:BASAL BODY TEMPERATURE(BBT)CHART


